Slideshow


European Cups Ranking System Explanation ECRS Ranking Comparison between nations in European Cups

sabato 29 novembre 2014

European Cups: Legia Warsaw is the best team after the 5th matchday of the Group Stage


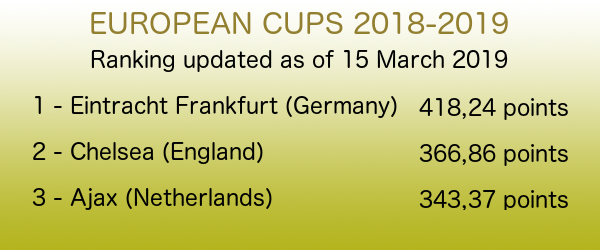
According to the ECRS, after the 5th matchday of the Group Stage Legia Warsaw* (Poland) are still at the top of the table with 283,54 points, even having lost 0-1 the latest match against Lokeren (Belgium).
Also the team at the second place didn't change: Dynamo Moscow (Russia) won 2-1 against Panathinaikos (Greece) and they are getting closer to Legia, at 277,70 points.
At the third place, with 265,32 points, we find Porto (Portugal), which is also the best team that participate in the Champions League.

The worst team still in the competition is Galatasaray (Turkey), who are third to last, with only 6,36 points.

The complete ranking is here.

* Please note: Legia Warsaw was punished by UEFA for fielding an ineligible player in their 2-0 second leg's win over Celtic in the third qualifying round. I decided to consider it as a 0-3 lost, as stated by the official UEFA sentence.


Secondo l'ECRS,  dopo la 5a giornata della fase a gironi il Legia Varsavia* (Polonia) è ancora in testa alla classifica, con 283,54 punti, sebbene abbia perso 0-1 la partita contro il Lokeren (Belgio).
Anche la squadra seconda in classifica è sempre la Dinamo Mosca (Russia), che ha vinto 2-1 contro il Panathinaikos (Grecia) e si sta avvicinando al Legia, con 277,70 punti.
Al terzo posto, con 265,32 punti, c'è il Porto (Portogallo), che è anche la miglior squadra impegnata in Champions League.

La squadra peggiore ancora in gara è il Galatasaray (Turchia), che è terz'ultima in classifica con soli 6,36 punti.

La classifica completa si trova qui.

* Il Legia Varsavia è stato punito dalla UEFA per aver schierato un giocatore in modo irregolare durante la partita vinta per 2-0 contro il Celtic nel ritorno del terzo turno di Champions League. Ho quindi deciso di considerare quella partita come una sconfitta per 0-3, come stabilito dalla sentenza UEFA.


martedì 25 novembre 2014

Goal timing in 6 European Leagues


This table shows the distribution of the goals scored this season in the 6 main European leagues.
I have divided the matches in 15 minutes segments, but I decided to separate the goals scored in the injury time after the 90th minute, to get a more balanced result (otherwise too many goals seemed to be scored between the 75th and the 90th).
The goals scored in the first half injury time are counted inside the "31-45" segment, but they shouldn't be too many and don't shift the distribution.
The green cells indicate the highest percentage (for that nation), while the red cells are the lowest.


Nation 1-15 16-30 31-45 46-60 61-75 76-90 >90 Total of goals
England 13,85% 14,46% 14,46% 15,08% 19,08% 18,15% 4,92% 325
France 12,07% 12,69% 17,96% 16,72% 17,96% 18,27% 4,33% 323
Germany 14,68% 13,65% 17,06% 17,41% 15,36% 18,77% 3,07% 293
Italy 13,07% 17,97% 18,30% 14,05% 15,69% 17,32% 3,59% 306
Portugal 13,97% 13,97% 14,85% 17,03% 17,90% 19,21% 3,06% 229
Spain 11,88% 12,19% 20,63% 14,06% 16,88% 18,44% 5,94% 320

It is clear that most of the goals are scored in the last 15 minutes of the two halves of the match. Very few are scored in the first 15 minutes.
A good percentage of goals are scored in the injury time, especially in Spain and England.


La tabella qui sopra mostra la distribuzione temporale delle reti segnate nei 6 principali campionati europei finora in questa stagione.
Ho diviso le partite in segmenti di 15 minuti, ma separando i gol segnati nel tempo di recupero per avere un risultato più bilanciato (altrimenti sembrerebbero essere stati segnati troppi gol tra il 75° e il 90°).
Le reti segnate nel recupero del primo tempo sono contate nel segmento "31-45", ma non dovrebbero essere molte e quindi non spostano di molto la distribuzione.

Le celle verdi identificano la percentuale più alta (per la singola nazione), mentre quelle rosse indicano quella più bassa.
La maggior parte delle reti viene segnata negli ultimi 15 minuti di entrambi i tempi, mentre molto poche sono segnate nei primi 15 minuti.
Una buona percentuale di gol viene segnata dopo il 90°, soprattutto in Spagna e Inghilterra.

venerdì 21 novembre 2014

Goal timing in the English Premier League


Clicking the image above you can see a data visualization on the timing of goals in the English Premier League in this season, considering segments of 15 minutes each.

At this moment, before the 12th matchday, 22,59% of the goals were scored in the last 15 minutes, and 42,19% in the last 30 (always including the injury time).

The record of goals scored in one segment belongs to Manchester City, who so far scored 8 times in the last 15 minutes (including the injury time).
Aston Villa never scored in the last 30 minutes, as Newcastle in the first 30.


In the visualization you will find the charts about goals scored, goals conceded, the difference (scored - conceded) and the sum (scored + conceded) of goals for each team and each segment.


Cliccando l'immagine sopra, potete vedere una visualizzazione dati riguardante la distribuzione dei gol segnati in questa stagione nella Premier League inglese, considerando segmenti di partita di 15 minuti l'uno.

Al momento, prima della 12a giornata, il 22,59% delle reti sono state segnate negli ultimi 15 minuti, e il 42,19% negli ultimi 30 (sempre considerando anche i minuti di recupero).
Il record di gol segnati in uno dei segmenti è del Manchester City, che è andato a segno finora 8 volte nell'ultimo quarto d'ora delle partite (incluso il tempo di recupero).
L'Aston Villa non ha mai segnato negli ultimi 30 minuti, mentre il Newcastle mai nei primi 30.

Nella visualizzazione trovate i grafici riguardanti gol segnati, gol subiti, la differenza (segnati - subiti) e la somma (segnati + subiti) delle reti per ciascuna squadra e ciascun segmento.


lunedì 17 novembre 2014

Data visualization about the importance of scoring first


I made a data visualization about the importance of scoring first, explained in this post.
Click the image above to go to an interactive chart.

Ho creato una visualizzazione dati riguarda l'importanza di segnare per primi, spiegata in questo post.
Cliccate sull'immagine sopra per andare al grafico interattivo.


venerdì 14 novembre 2014

The importance of scoring first


I checked the last five seasons in the main 6 European leagues (England, France, Germany, Italy, Portugal, Spain) to see how strong is the correlation between the points made and a score linked to the number of times that a team scored first in a match.

To calculate this second score, that I call "First to score efficiency", I gave 1 point for a match where the team scored first, 0,5 points for a match ended 0-0, and then I calculate (score + (n° of matchdays)) / (n° of matchdays * 2).

For example, for the English Premier League, the formula is (score + 38) / 76.
This score thus goes from a minimum of 0,5 (if the team never scored the first goal of the match) to a maximum of 1 (if the team scored the first goal in all the matches).

At this link you can see an interactive chart about it.


These are the correlations:


[​IMG]

They are almost all in the same range (0,80-0,93), with few exceptions.
The most remarkable is the German 2010-2011 season, with a correlation of only 0,6621.
In that season there were some teams that had very different results between the "First to score efficiency" and the number of points made. In particular:
Mainz scored first in only 13 matches (out of 34), but ended 5th in the league: they won 7 games after that the opponent scored first;
- three teams won less than 50% of the matches they scored first in: Hoffenheim won 8 out of 20, Wolfsburg 8 out of 17, Moenchengladbach 9 out of 19. All these three teams had an efficiency score around 0.80 (quite high), but ended respectively at the 11th, 15th and 16th place in the table.

The highest correlation overall (0,9605) is the one of Barcelona in 2009/2010, when they had an efficiency score of 35 (out of 38), scoring 99 points.
The lowest (0,6083) is the one of last season's Paços de Ferreira: they had an efficiency score of only 6.5 (out of 30), however scoring 24 points at the end of the season.

The longest streak belongs to, again, 2009-2010's Barcelona, with a series of 14 matches where they scored first (from the 8th to the 21st matchday). Counting also the 0-0 draws, the streak stretches to 21 matches (from 1st to 21st) without conceding the first goal to the opponent.


Prendendo in considerazione le ultime cinque stagioni nei principali 6 campionati europei (Inghilterra, Francia, Germania, Italia, Portogallo, Spagna) per verificare quanto forte è la correlazione tra i punti fatti da una squadra e un punteggio collegato al numero di partite in cui la squadra ha segnato il primo gol della partita.


Per calcolare questo secondo punteggio, che ho chiamato "First to score efficiency", ho assegnato 1 punto per ogni partita in cui la squadra ha segnato per prima, 0,5 punti per ciascuna partita terminata 0-0, e quindi ho calcolato la seguente formula: punteggio + (n° di partite)) / (n° di partite * 2).

Per esempio, per la Serie A la formula è (punteggio + 38) / 76.
Il punteggio va quindi da un minimo di 0,5 (se la squadra non ha mai segnato per prima) a un massimo di 1 (se la squadra ha sempre segnato per prima).

questo link trovate un grafico interattivo sull'argomento.


Nella tabella pubblicata sopra trovate le correlazioni, che si trovano quasi tutte nello stesso intervallo di valori (0,80-0,93), con poche eccezioni.

La più evidente è la Germania nel 2010-2011, con una correlazione di 0,6621.
In quella stagione ci sono state alcune squadre che hanno avuto risultati molto diversi tra il "First to score efficiency" e il numero di punti fatti. In particolare:
- il Mainz ha segnato per primo solo in 13 partite (su 34), ma ha terminato il campionato al 5° posto: ha infatti vinto 7 partite in rimonta, dopo che l'avversario aveva segnato la prima rete.
- tre squadre hanno vinto meno del 50% delle partite in cui hanno segnato per prime: l'Hoffenheim ne ha vinte 8 su 20, il Wolfsburg 8 su 17, e il Moenchengladbach 9 su 19. Tutte queste tre squadre hanno un punteggio di efficienza intorno allo 0,80 (piuttosto alto), ma hanno terminato rispettivamente all'11°, 15° e 16° posto in classifica.

La correlazione più alta (0,9605) è del Barcellona nel 2009/2010, quando ha avuto un'efficienza di 35 (su un massimo di 38), chiudendo il campionato a 99 punti.

La più bassa (0,6083) è del Paços de Ferreira nella scorsa stagione, in cui ha avuto un punteggio di efficienza solo di 6.5 (su 30), totalizzando tuttavia 24 punti in classifica alla fine del campionato.

La striscia positiva più lunga appartiene, ancora, al Barcellona del 2009-2010, con una serie di 14 partite in cui la squadra ha segnato per prima (dall'ottava giornata alla ventunesima). Contando anche i pareggi per 0-0, la striscia si estende a 21 partite (dalla prima alla ventunesima) senza concedere alla squadra avversaria il primo gol della partita.