Slideshow


European Cups Ranking System Explanation ECRS Ranking Comparison between nations in European Cups

lunedì 28 marzo 2016

Goal timing in 6 European Leagues up to 24th March 2016 (clubs stats)


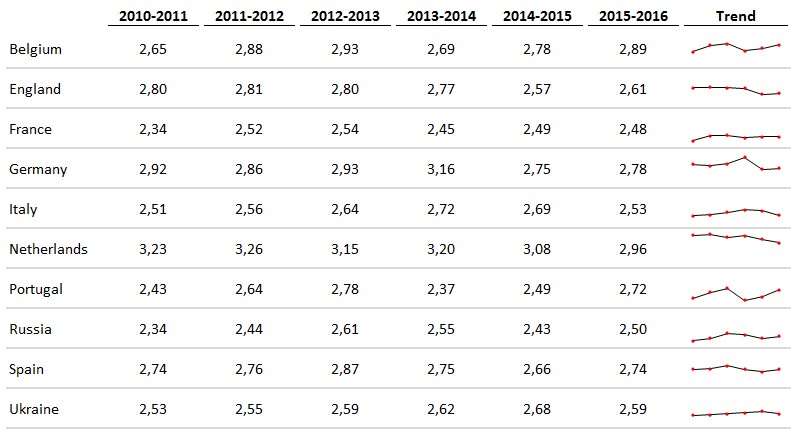
These are the data until 24th March 2016 regarding the clubs who scored the most in each segment of the match.
1-15: Real Madrid (Spain) 16 goals
16-30: Real Madrid (Spain) 17
31-45 (including 1st half injury time): Barcelona and Real Madrid (Spain) 15
46-60: Barcelona (Spain) 20
61-75: Bayern Munich (Germany) 20
76-90: Real Madrid (Spain) 17
91+: Borussia Dortmund (Germany) and Lazio (Italy) 6

These are the data regarding the clubs who scored the largest percentage of their own goals in each segment.
1-15: Troyes (France) 22,73%
16-30: Deportivo La Coruña (Spain) 30,77%
31-45 (including 1st half injury time): Ajaccio (France) 32,26%
46-60: União Madeira (Portugal) 33,33%
61-75: Aston Villa (England) 40,91%
76-90: Köln (Germany) 32,14%
91+: Lazio (Italy) 15,79%

Note: all the data are all from the current season, and refer to the domestic leagues of England, France, Germany, Italy, Portugal and Spain.


Qui sopra trovate due liste.
Nella prima ci sono le squadre che hanno segnato di più in ciascun segmento di partita; nella seconda le squadre che, per ciascun segmento, hanno segnato più gol in percentuale rispetto al totale dei propri gol.

Nota bene: i dati sono relativi a questa stagione, e si riferiscono ai campionati di Inghilterra, Francia, Germania, Italia, Portogallo e Spagna.


sabato 26 marzo 2016

Goal timing in 6 European Leagues up to 24th March 2016 (leagues stats)


This table shows the distribution of the goals scored in the 2015/2016 season (up to 24th March 2016) in the 6 main European leagues.

I have divided the matches in 15 minutes segments, but I decided to separate the goals scored in the injury time after the 90th minute, to get a more balanced result (otherwise too many goals seemed to be scored between the 75th and the 90th). The goals scored in the first half injury time are counted inside the "31-45" segment, but they shouldn't be too many and don't shift the distribution. 
           1-15    16-30    31-45    46-60    61-75    76-90    >90
England   11,00%   16,31%   16,56%   16,56%   16,69%   18,58%  4,30%
France    12,50%   14,19%   16,67%   16,28%   17,06%   18,36%  4,95%
Germany   10,81%   15,41%   17,48%   16,00%   18,07%   18,37%  3,85%
Italy     12,25%   15,42%   16,47%   16,21%   17,26%   15,81%  6,59%
Portugal  15,41%   13,90%   15,56%   16,77%   16,01%   18,73%  3,63%
Spain     14,37%   16,57%   15,10%   16,32%   14,98%   18,51%  4,14%

Global    12,71%   15,35%   16,29%   16,35%   16,64%   18,05%  4,60%
Unlike last season (when the last segments of the two halves were the most prolific), now there is a general increasing in scoring while the matches go towards the end.
The first 15 minutes are the less prolific everywhere, except in Portugal, where teams score less during the 16-30 segment.
On the contrary, Italian Serie A is the only league where the most prolific segment is not the last one, but from 61st to 75th.


La tabella qui sopra mostra la distribuzione temporale delle reti segnate nei 6 principali campionati europei finora in questa stagione.
Ho diviso le partite in segmenti di 15 minuti, ma separando i gol segnati nel tempo di recupero per avere un risultato più bilanciato (altrimenti sembrerebbero che vengano segnati troppi gol tra il 75° e il 90°).
Le reti segnate nel recupero del primo tempo sono contate nel segmento "31-45", ma non dovrebbero essere molte e quindi non spostano di molto la distribuzione.

Diversamente dalla scorsa stagione (quando l'ultimo segmento di entrambi i tempi è stato il più prolifico), ora c'è un incremento nel numero di gol segnati man mano che la partita prosegue e si avvicina alla fine.
I primi 15 minuti sono i meno prolifici dappertutto tranne che in Portogallo, dove le squadre segnano di meno nel segmento 16-30.
Al contrario, la Serie A italiana è l'unico campionato in cui il segmento più prolifico non è l'ultimo della partita, ma quello dal 61° al 75°.


venerdì 25 marzo 2016

Minutes leading and trailing - updated as of 24 March 2016


Update of the statistic about how many minutes, on average, each club has led or trailed so far this season (until 24th March).

At the moment, the best leading teams are:
Barcelona (Spain), with an average of 48,9 minutes leading
Real Madrid (Spain) 47,2 minutes
Benfica (Portugal) 44,1 minutes

The teams that trailed the least are:
Paris Saint-Germain (France)with an average of 4,9 minutes trailing
Barcelona (Portugal) 5,2 minutes
Napoli (Italy) 6,2 minutes

You can find the two full rankings here (there are two worksheets): https://docs.google.com/spreadsheets/d/1N1_C39UQjAqhzLH3x4HabwL1fEkffCPd2kdaBthxPbU/edit?usp=sharing

Note: all the data are all from the current season, and refer to the domestic leagues of England, France, Germany, Italy, Portugal and Spain.


Aggiornamento al 24 marzo della statistica riguardante quanti minuti, in media, ogni squadra si trova in vantaggio o in svantaggio nel corso di una partita.

Al momento, le squadre che si sono trovate più tempo in vantaggio sono:
Barcellona (Spagna), che ha trascorso in media 48,9 minuti in vantaggio
Real Madrid (Spagna) 47,2 minuti
Benfica (Portogallo) 44,1 minuti

Le squadre che sono state in svantaggio meno tempo sono:
Paris Saint-Germain (Francia)che ha trascorso in media 4,9 minuti in svantaggio
Barcellona (Spagna) 5,2 minuti
Napoli (Italia) 6,2 minuti

Trovate le due classifiche complete qui (ci sono due fogli): https://docs.google.com/spreadsheets/d/1N1_C39UQjAqhzLH3x4HabwL1fEkffCPd2kdaBthxPbU/edit?usp=sharing

Nota bene: i dati sono relativi a questa stagione, e si riferiscono ai campionati di Inghilterra, Francia, Germania, Italia, Portogallo e Spagna.


mercoledì 23 marzo 2016

Scoring trend until 23rd Match


In the following table there is the average number of goals scored per game in the 10 main European leagues, considering the last 6 seasons, including the current one.
You can also see the trend for each league.

Until now, the only two leagues with a significant decrease compared to last year are Italian Serie A, which passed from an average of 2,69 to 2,53 (-6%) and Dutch Eredivisie (from 3,08 to 2,96, -4%).
However, Eredivisie is still the top league as for the average number of goals scored.

Portugal's Primeira Liga records the greatest increase (from 2,49 to 2,72, +9%).

French Ligue 1 has the lowest average with 2,48 (and PSG scored 10% of the total goals).


Nella tabella soprastante potete vedere il numero medio di reti per partita segnate nei 10 principali campionati europei, considerando le ultime 6 stagioni inclusa quella attuale.
All'estrema destra di ciascuna riga si può vedere il trend del rispettivo campionato.

Fino ad ora, gli unici due campionati con un decremento significativo rispetto all'anno scorso sono la Serie A italiana, passata da una media di 2,69 a 2,53 (-6%) e la Eredivisie olandese (da 3,08 a 2,96, -4%).
Comunque, la Eredivisie è ancora il campionato più prolifico.

La Primeira Liga portoghese registra l'incremento maggiore (da 2,49 a 2,72, +9%).

La Ligue 1 francese ha la media più bassa con 2,48 (e il PSG ha segnato il 10% delle reti totali).


sabato 19 marzo 2016

European Cups: Wolfsburg are the new leaders after Round of 16


According to the ECRS, after the Round of 16 the top three teams in the European Cups are:
1) Wolfsburg (Germany), with 330,91 points.
2) Paris Saint-Germain (France), with 267,01 points.
3) Bayern Munich (Germany), with 265,48 points.

Now the top 3 teams are all in Champions League, because from the Round of 16 onward the points made in CL rounds are doubled.

Wolfsburg is by far the top team in this moment, because they reached the Quarter-finals in Champions League, but they were the worst team considering the score in the last 5 seasons of the teams who reached at least the Round of 16 this year; therefore, Wolfsburg's coefficients are always quite high.

The worst team still in the competition is Sevilla (Spain), with 142,06 points (42nd position). 

The complete ranking is here.


Secondo l'ECRS, dopo gli ottavi di finale le prime tre squadre nelle Coppe Europee sono:
1) Wolfsburg (Germania), con 330,91 punti.
2) Paris Saint-Germain (Francia), con 267,01 punti.
3) Bayern Munich (Germania), con  265,48 punti.

Adesso le 3 squadre migliori sono tutte in Champions League, grazie al fatto che dagli Ottavi in poi i punti fatti in ogni turno di CL vengono raddoppiati.

Il Wolfsburg è di gran lunga la squadra migliore in questo momento, perché hanno raggiunto i Quarti di CL, pur essendo la squadra con il punteggio peggiore degli ultimi 5 anni tra i club che hanno raggiunto almeno gli Ottavi quest'anno; quindi il Wolfsburg ha quasi sempre un coefficiente piuttosto alto.

La squadra peggiore ancora in gara è il Siviglia (Spagna), con 142,06 punti (42esima posizione). 

Potete consultare qui la classifica completa.