Yesterday, Bayern Munich won 7-0 at home against Shakhtar Donetsk, after having tied 0-0 the first leg in Ukraine.
It's the third time that Bayern Munich score 7 goals in the 2nd leg of the Champions League's Round of 16: it happened twice in recent years, the first time in 2008-2009 against Sporting Lisbon (1st leg 5-0 and 2nd leg 7-1), and the second time in 2011-2012 against FC Basel (they lost the first leg 0-1, and then won 7-0 in Munich).
This was also the last time that a team scored at least 7 goals in a Champions League match, considering only the rounds from the Round of 16 onwards. Barcelona also won 7-1 against Bayer Leverkusen in the same round of 2011-2012 season, but this happened the week before Bayern Munich's match against FC Basel.
Ieri il Bayern Monaco ha vinto 7-0 in casa contro lo Shakhtar Donetsk, dopo aver pareggiato all'andata 0-0 in Ucraina.
È la terza volta che il Bayern Monaco segna 7 reti nel ritorno di un ottavo di finale di Champions League: è successo entrambe le volte in tempi recenti, la prima nel 2008-2009 contro lo Sporting Lisbona (andata 5-0 e ritorno 7-1), e la seconda nel 2011-2012 contro il Basilea (i tedeschi avevano perso all'andata 0-1 per poi vincere 7-0 a Monaco).
Questa era anche l'ultima volta in cui una squadra aveva segnato almeno 7 reti in una partita di Champions League, considerando i turni dagli ottavi di finale in poi. Anche il Barcellona aveva battuto 7-1 il Bayer Leverkusen nello stesso turno della stagione 2011-2012, ma la partita era stata giocata la settimana prima di Bayern Monaco - Basilea.
Yesterday, Real Madrid suffered a 3-4 loss at home against Schalke 04, but they managed to go through the round of Champions League.
The last (and only) time that Real Madrid conceded 4 goals at home in a European Cup was on 29th February 2000, against another German team, Bayern Munich; the match ended 2-4. It was the third matchday of the second group stage, and both the teams finally went through the stage.
Ieri il Real Madrid ha subìto una sconfitta per 3-4 in casa contro lo Schalke 04, ma è riuscito comunque a superare il turno di Champions League.
L'ultima (e unica) volta che il Real Madrid concesse 4 reti in casa in una coppa europea fu il 29 febbraio 2000, contro un'altra squadra tedesca, il Bayern Monaco; la partita terminò 2-4. Si trattava della terza giornata della seconda fase a gironi, ed entrambe le squadre riuscirono a superare il turno.
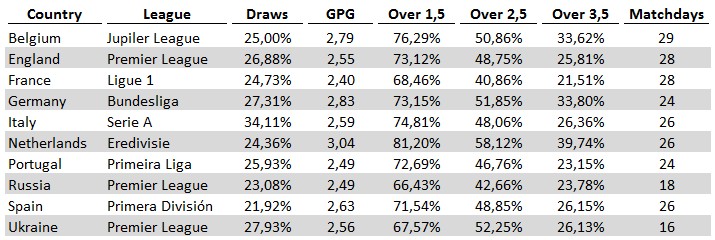
In the table below you can see some stats about the top 10 European leagues, regarding the matches played until now in this season.
This is the legend:
Draws = percentage of matches ended with a draw;
GPG = average goals scored per game;
Over 1,5 / Over 2,5 / Over 3,5 = percentage of matches where the total number of goals was over the set threshold;
Matchdays = number of matchdays played until now.
The league with the highest number of goals scored per game is the Eredivisie (Netherlands), while the French Ligue 1 has the lowest.
Italy's Serie A is the league with the highest number of draws.
Nella tabella qui sopra potete vedere alcune statistiche dei 10 principali campionati europei, riguardo alle partite giocate finora in questo inizio di stagione.
Questa è la legenda:
Draws = percentuale di partite terminate con un pareggio;
GPG = media delle reti segnate per partita;
Over 1,5 / Over 2,5 / Over 3,5 = percentuale di partite in cui sono state segnate più reti del limite indicato;
Matchdays = numero di giornate giocate finora.
Nella tabella si nota che il campionato dove si segnano più gol per partita è la Eredivisie olandese, mentre quello in cui si segna di meno è la Ligue 1 francese.
La Serie A italiana è il campionato con il maggior numero di pareggi.
These are the best (or worst) teams in keeping the lead or coming back in the second half.
When I write two capital letters, the first is the result at half-time, and the second is the result at the end of the match. For example, LD means that the team was losing at half-time, but eventually managed to equalize the match. Of course, W=win, D=draw, L=loss.
I consider only:
- the club teams of England, France, Germany, Italy, Portugal and Spain;
- among these, only the teams who had W1 (wining at half-time) or L1 (trailing at half-time) at least in one third of the matches played.
The best team in keeping the lead is Benfica (Portugal), with 13 WW out of 13 W1 matches (full marks). They played 22 matches.
The worst team in keeping the lead is Moreirense (Portugal), with 4WL and 1 WD out of 9 W1 matches; in the second halves of these games, they lost 1,55 points per game. Overall, they played 22 matches.
The best team in coming back is Malaga (Spain), with 3 LW and 2 LD out of 13 L1; in the second halves of these games, they gained 0,85 points per game. Overall, they played 24 matches.
The worst team in coming back is Toulouse (France), with 11 LL out of 11 L1. They played 26 matches.
Juventus (Italy) is the only team who never trailed at half-time unitl now in this season.
All the teams lead at least once at half-time.
Queste sono le squadre migliori e peggiori nel mantenere un vantaggio o recuperare uno svantaggio durante il secondo tempo delle partite.
Quando scrivo due lettere maiuscole, la prima è il risultato alla fine del primo tempo, mentre la seconda è il risultato finale. W sta per vittoria, D per pareggio e L per sconfitta. Per esempio, LD significa che la squadra stava perdendo alla fine del primo tempo ma è riuscita a recuperare, pareggiando l'incontro.
Ho preso in considerazione solamente:
- le squadre di Francia, Germania, Inghilterra, Italia, Portogallo e Spagna;
- tra queste, solo le squadre che hanno un numero di W1 (vittorie alla fine del primo tempo) o L1 (sconfitte alla fine del primo tempo) uguale ad almeno un terzo delle partite giocate.
La squadra migliore nel mantenere il vantaggio è il Benfica (Portogallo), con 13 WW su 13 W1 (punteggio pieno). La squadra ha giocato 22 partite in tutto.
La squadra peggiore nel mantenere il vantaggio è la Moreirense (Portogallo), con 4 WL e 1 WD su 9 W1; nei secondi tempi di queste partite, hanno perso 1,55 punti per gara. La squadra ha giocato 22 partite in tutto.
Le squadre migliori nel recuperare lo svantaggio è il Malaga (Spagna), con 3 LW e 2 LD su 13 L1; nei secondi tempi di queste partite, hanno guadagnato 0,85 punti per gara. La squadra ha giocato 24 partite in tutto.
La squadra peggiore nel recuperare lo svantaggio è il Tolosa (Francia), con 11 LL su 11 L1. La squadra ha giocato 26 partite in tutto.
La Juventus (Italia) è l'unica squadra a non essere mai stata in svantaggio alla fine del primo tempo.
Tutte le squadre si sono trovate in vantaggio alla fine del primo tempo almeno una volta.
I made some tables about the performance of the clubs in the first and second half of the matches.
I took into account only the domestic league games played in this season in the following countries: England, France, Germany, Italy, Portugal and Spain.
The data are updated as of yesterday, 24 February 2015.
In the tables, the W1, D1 and L1 columns are the wins, the draws and the losses considering only the first half.
W2, D2 and L2 are the wins, the draws and the losses considering only the second half.
WF, DF and LF are the wins, the draws and the losses at the end of the match.
These are the top 3 teams in the 1st half.
![[IMG]](http://nicolacerin.altervista.org/images/HTFT_Best_HT_20150225.jpg)
Worst 3 teams in the 1st half.
![[IMG]](http://nicolacerin.altervista.org/images/HTFT_Worst_HT_20150225.jpg)
Best 3 teams in the 2nd half.
![[IMG]](http://nicolacerin.altervista.org/images/HTFT_Best_2H_20150225.jpg)
Worst 3 teams in the 2nd half.
![[IMG]](http://nicolacerin.altervista.org/images/HTFT_Worst_2H_20150225.jpg)
Best 3 teams comparing the final result and the 1st half.
![[IMG]](http://nicolacerin.altervista.org/images/HTFT_Best_Diff_20150225.jpg)
Worst 3 teams comparing the final result and the 1st half.
![[IMG]](http://nicolacerin.altervista.org/images/HTFT_Worst_Diff_20150225.jpg) Come vedete qui sopra, ho creato alcune tabelle riguardo al rendimento delle squadre di club nel primo e nel secondo tempo delle partite.
Ho preso in considerazione solo le partite giocate quest'anno in campionato, per le seguenti nazioni: Francia, Germania, Inghilterra, Italia, Portogallo e Spagna.
I dati sono aggiornati a ieri, 24 febbraio 2015.
Come vedete qui sopra, ho creato alcune tabelle riguardo al rendimento delle squadre di club nel primo e nel secondo tempo delle partite.
Ho preso in considerazione solo le partite giocate quest'anno in campionato, per le seguenti nazioni: Francia, Germania, Inghilterra, Italia, Portogallo e Spagna.
I dati sono aggiornati a ieri, 24 febbraio 2015.
Legenda delle tabelle:
- W1, D1 e L1 indicano il numero di vittorie, pareggi e sconfitte considerando solo i primi tempi;
- W2, D2 e L2 indicano il numero di vittorie, pareggi e sconfitte considerando solo i secondi tempi;
- WF, DF e LF indicano il numero di vittorie, pareggi e sconfitte alla fine della partita.
Le 6 tabelle, dall'alto verso il basso, mostrano:
- migliori 3 squadre per media punti nel primo tempo;
- peggiori 3 squadre per media punti nel primo tempo;
- migliori 3 squadre per media punti nel secondo tempo;
- peggiori 3 squadre per media punti nel secondo tempo;
- migliori 3 squadre per differenza punti tra primo tempo e fine partita;
- peggiori 3 squadre per differenza punti tra primo tempo e fine partita.