Slideshow


European Cups Ranking System Explanation ECRS Ranking Comparison between nations in European Cups
Visualizzazione post con etichetta Domestic Leagues Ranking System. Mostra tutti i post

venerdì 6 febbraio 2015

Domestic ranking as of 6 February 2015


This is the 2014/2015 European club teams ranking according to the Domestic Leagues Ranking System.
This system takes into account the matches played in the 10 main European leagues, with the points made, the goals scored and conceded by each team, and the strength of the league.

In the table below you can see the top 10 teams as of today, 6 February 2015.

Real Madrid always lead the ranking. They also have the best attack (3,33 goals per game).

The best defence is the Benfica's one, with 0,42 goals conceded per game.
The best team as for the points made is PSV Eindhoven, with 2,62 points per game.

Worst teams:

Goals scored: Aston Villa (0,48 goals per game)
Goals conceded: Dordrecht (2,29 goals per game)
Points: Illichivets Mariupol (0,21 points per game)

The full ranking is on this page.


[​IMG]


Nella tabella qui sopra trovate le prime 10 posizioni della classifica 2014/2015 secondo il Domestic Leagues Ranking System. Questo sistema prende in considerazione le partite giocate nei dieci principali campionati europei, con i punti fatti, i gol segnati e quelli subiti da ciascuna squadra, e la forza del campionato.

Nella tabella vedete le migliori dieci squadre ad oggi, 6 febbraio 2015.


Il Real Madrid continua ad essere in testa, avendo anche il miglior attacco (3,33 gol a partita).
La miglior difesa è quella del Benfica, con 0,42 reti subite per partita.
Il maggior numero di punti per partita è del PSV Eindhoven, con una media di 2,62.

Le squadre peggiori sono le seguenti:
Reti segnate: Aston Villa (0,48 gol per partita)
Reti subite: Dordrecht (2,29 gol per partita)
Punti: Illichivets Mariupol (0,21 punti a partita)

Qui trovate la classifica completa e la legenda.


venerdì 5 dicembre 2014

Domestic ranking as of 5 December 2014


This is the European club teams ranking according to the Domestic Leagues Ranking System.
As explained in the linked post, this system takes into account the matches played in the 10 main European leagues, with the points made, the goals scored and conceded by each team, and the strength of the league.

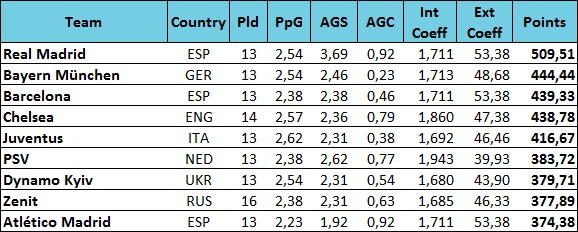
These are the best ten teams as of today, 5 December 2014:


You find the complete ranking and the legend here.


Nella tabella qui sopra si vedono le prime 10 posizioni della classifica secondo il Domestic Leagues Ranking System. Come spiegato nel post, questo sistema prende in considerazione le partite giocate nei dieci principali campionati europei, con i punti fatti, i gol segnati e quelli subiti da ciascuna squadra, e la forza del campionato.

Nella tabella vedete le migliori dieci squadre ad oggi, 5 dicembre 2014.

Qui trovate la classifica completa e la legenda.


giovedì 13 novembre 2014

Domestic ranking as of 13 November 2014


I made the first ranking of this season according to the Domestic Leagues Ranking System.
As explained in the linked post, this system takes into account the matches played in the 10 main European leagues, with the points made, the goals scored and conceded by each team, and the strength of the league.

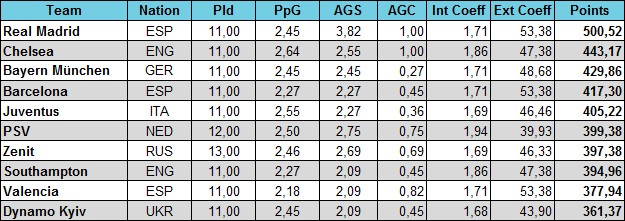
These are the best ten teams as of today:


You find the complete ranking and the legend here.


Ho creato la prima classifica seguendo il Domestic Leagues Ranking System. Come spiegato nel post, questo sistema prende in considerazione le partite giocate nei dieci principali campionati europei, con i punti fatti, i gol segnati e quelli subiti da ciascuna squadra, e la forza del campionato.

Nella tabella sopra vedete le migliori dieci squadre.

Qui trovate la classifica completa e la legenda.


domenica 9 novembre 2014

Domestic Leagues Ranking System


I created a system to evaluate the performances of the European teams in their own domestic leagues.
I take the average points made (PpG), average goals scored (AGS) and average goals conceded (AGC), calculating this formula: PpG + (AGS-AGC)/2,5
This score is then multiplied by 1,5.

To consider also the strength of each league, I multiply the result by two coefficients:
1) The external coefficient is the national coefficient (NC), that is based on the performances of the teams in the UEFA Cups in the last three years. The system to calculate the NC is explained on this post.
2) The internal coefficient is calculated considering, for each season, the 25th and 75th percentile of the points made per single game by all the teams. These two numbers are the points per game needed by a team to be, respectively, in the top 75% or in the top 25% of the table; therefore they are (roughly) the points needed to avoid the relegation or to partecipate in the Europa League. Then these two values are divided by the number of matches played in that league, and multiplied to obtain only one number.

The final score is then equal to (team's score) * (external coefficient) * (internal coefficient)

A team gets a final bonus of 2% if they are at the first position of the league.


Example
Let’s see how to calculate the score of Liverpool, as of today 9 November 2014.
Liverpool played 11 matches in the Premier League, gaining 14 points, scoring 14 goals and conceding 15.
The result of PpG + (AGS-AGC)/2,5 formula is ~1,236.
This is then multiplied by 1,5 obtaining a score of ~1,85.

The strength of the Premier League is calculated as follows.
The external coefficient of England is 47,38 (it takes into account the results of the English clubs in the European Cups in the last three seasons, as explained in this post).
To calculate the internal coefficient, I calculate the 25th and 75th percentile of the points per game made in the Premier League in the last three seasons, which are respectively ~1,031 and ~1,805. They are multiplied to obtain the internal coefficient of the English Premier League, which is ~1,86.
The external and internal coefficients are multiplied to obtain the final coefficient of the Premier League: 47,38 * ~1,86 = ~88,14.

The score of Liverpool at this point of the season is then ~1,85 * ~88,14 = 163,46 (rounded).


Of course, the league coefficients (both external and internal) are set at the beginning of the season and they won’t change, since they are calculated on the results of the previous three years.
On the contrary, the score of each team changes every match they play.

If it happens that there is at least one team with a negative score, I adjust the points of all teams in this way: the best score remains unchanged, while the worst is converted to 1, and all the other scores are adjusted proportionally. In this way, the worst teams gain more points in the ranking, while the best teams gain few points (the first team gains no points).
In any case, the positions in the ranking don't change.
This is the formula to make the adjustment (TS = team score, BS = best score, WS = worst score): TS + ((1-WS)/(BS-WS))*(BS-TS).


In questo post spiego un sistema da me creato per calcolare il rendimento delle squadre europee nei rispettivi campionati.
Considero la media dei punti fatti (PpG), dei gol segnati (AGS) e di quelli subiti (AGC), calcolando questa formula: PpG + (AGS-AGC)/2,5
Questo punteggio è poi moltiplicato per 1,5.

Per considerare anche la forza dei singoli campionati, il punteggio viene moltiplicato per due diversi coefficienti:
1) Il coefficiente esterno è il coefficiente nazionale (NC), basato sul rendimento delle squadre nelle coppe europee negli ultimi tre anni. Il sistema per eseguire il calcolo è spiegato in questo post.
2) Il coefficiente interno è calcolato considerando, per ciascuna stagione, il 25esimo e il 75esimo percentile dei punti fatti per partita da tutte le squadre. Questi sono i punti necessari per una squadra per essere, rispettivamente, nel miglior 75% o nel miglior 25% della classifica; quindi sono (a grandi linee) i punti necessari per evitare la retrocessione o per qualificarsi all'Europa League. Quindi questi due valori sono divisi per il numero di partite giocate in quel campionato, e moltiplicati tra di loro per ottenere un coefficiente unico.

Il punteggio finale è quindi uguale a (punteggio della squadra) * (coefficiente esterno) * (coefficiente interno)

Le squadre prime in classifica nei loro rispettivi campionati ottengono inoltre un bonus finale del 2%.


Esempio
Vediamo come calcolare il punteggio della Sampdoria, ad oggi 9 novembre 2014.
La Sampdoria ha giocato 11 partite in Serie A, guadagnando 20 punti, segnando 14 reti e subendone 8.
Il risultato della formula PpG + (AGS-AGC)/2,5 è circa 2,036.
Questo viene poi moltiplicato per 1,5 ottenendo un punteggio di circa 3,054.

La forza della Serie A è calcolata come segue.
Il coefficiente esterno dell'Italia è 46,46 (calcolato prendendo in considerazione i risultati dei club italiani nelle coppe europee negli ultimi tre anni, come spiegato in questo post).
Per calcolare il coefficiente interno, vengono considerati il 25esimo e il 75esimo percentile dei punti per partita fatti in Serie A negli ultimi tre anni, che sono rispettivamente circa 1,044 e circa 1,621. Questi punteggi sono moltiplicati tra di loro per ottenere il coefficiente interno della Serie A, che è circa 1,692.
I coefficienti esterno e interno vengono quindi moltiplicati tra di loro per ottenere il coefficiente finale della Serie A: 46,46 * ~1,692 = 78,60 (circa).

Il punteggio della Sampdoria a questo punto della stagione è quindi ~3,054 * ~78,60 = 240,08 (arrotondato).


Ovviamente, i coefficienti relativi al campionato (sia esterno che interno) sono stabiliti all'inizio della stagione e non cambieranno, dato che si basano sui risultati dei precedenti tre anni.
Al contrario, il punteggio della squadra cambia dopo ogni partita giocata.

Se almeno una squadra ha un punteggio negativo, modifico tutti i punteggi proporzionalmente in questo modo: il miglior punteggio resta inalterato, il peggiore viene portato a 1, mentre tutti gli altri vengono modificati in modo proporzionale. In questo modo, le squadre peggiori guadagnano più punti in classifica, mentre quelle minori ne guadagnano meno (la prima in classifica non guadagna alcun punto).
Le posizioni in classifica restano comunque immutate.
Questa è la formula usata per questa regolazione (TS = punteggio della squadra, BS = punteggio migliore, WS = punteggio peggiore): TS + ((1-WS)/(BS-WS))*(BS-TS).