Slideshow


European Cups Ranking System Explanation ECRS Ranking Comparison between nations in European Cups
Visualizzazione post con etichetta 2014-2015. Mostra tutti i post

venerdì 13 novembre 2015

Best teams in scoring first


I computed some stats for the last season (2014/2015) regarding the teams who score first the most of the times.

I considered two kinds of "efficiencies":
1) how good was a team in scoring first, compared to the total number of matches; I gave 1 point for a match which a team scored first in, and 0,5 points for a match ended 0-0; then I applied the formula (score + n of matches) / (n of matches * 2); for example, for the English Premier League teams it is (score + 38) / 76; the final outcome, which I call coefficient, is between 0,5 and 1;
2) how good were the teams in keeping the lead after they scored first: I just counted the average points made by a team in the matches which they scored first in.

I considered only the teams who scored the first goal in at least half of the games played, and only in the 6 main European Leagues.
At this link you can find the complete ranking for the last season.
These are the best teams.

Best teams in scoring first:
1) Porto (Portugal) with a coefficient of 0,941 (in 34 matches, they scored first 29 times and twice they ended 0-0)
2) Barcelona (Spain) with a coefficient of 0,908 (in 38 matches, they scored first 30 times and twice they ended 0-0)
3) Benfica (Portugal) with a coefficient of 0,897 (in 34 matches, they scored first 26 times and twice they ended 0-0)

Best teams in keeping the lead after they scored first:
1) Barcelona (Spain) 2,767 avg points (27 Wins, 2 Draws and 1 Loss)
2) Sevilla (Spain) 2,727 avg points (19 W, 3 D)
3) Porto (Portugal) 2,724 avg points (25 W, 4 D)

I also got a final score, which is given by the multiplication of the two scores above. The top three teams in the last season were:
1) Porto (Portugal) with a score of 2,564 (0,941 * 2,724)
2) Barcelona (Spain) with a score of 2,512 (0,908 * 2,767)
3) Benfica (Portugal) with a score of 2,415 (0,897 * 2,692)


Ho calcolato alcune statistiche per la scorsa stagione (2014/2015) riguardo le squadre che hanno segnato per prime più volte.

Ho preso in considerazione due tipi di "efficienza":
1) quante volte una squadra ha segnato per prima in rapporto al numero totale di partite; ho dato 1 punto per ogni partita in cui la squadra ha segnato per prima, e 0,5 punti per ogni partita terminata 0-0; quindi applico la formula (punteggio + n° di partite) / (n° di partite * 2); per esempio, per la serie A il calcolo è (punteggio + 38) / 76; il risultato finale, che chiamo coefficiente, è compreso tra 0,5 e 1;
2) quanti punti, in media, ha fatto una squadra nelle partite in cui segna per prima.

Ho considerato solo le squadre che hanno segnato per prime un numero di volte pari almeno alla metà delle partite giocate, e solo nei 6 principali campionati europei.
A questo link trovate la classifica completa per la scorsa stagione.
Di seguito le squadre migliori.

Squadre migliori nel segnare per prime:
1) Porto (Portogallo) con un coefficiente di 0,941 (in 34 partite ha segnato per primo 29 volte, e 2 volte le partite sono terminate 0-0)
2) Barcelona (Spagnacon un coefficiente of 0,908 (in 38 partite ha segnato per primo 30 volte, e 2 volte le partite sono terminate 0-0)
3) Benfica (Portogallocon un coefficiente of 0,897 (in 34 partite ha segnato per primo 26 volte, e 2 volte le partite sono terminate 0-0)

Squadre migliori nel mantenere il vantaggio dopo aver segnato per prime:
1) Barcelona (Spagna) media punti 2,767 (27 Vittorie, 2 Pareggi e 1 Sconfitta)
2) Sevilla (Spagnamedia punti 2,727 (19 V, 3 P)
3) Porto (Portogallomedia punti 2,724 (25 V, 4 P)

Ho anche calcolato un punteggio finale, dato dalla moltiplicazione dei due punteggi calcolati sopra. Le tre squadre migliori nella scorsa stagione sono state:
1) Porto (Portogallo) con un punteggio di 2,564 (0,941 * 2,724)
2) Barcelona (Spagna) con un punteggio di 2,512 (0,908 * 2,767)
3) Benfica (Portogallocon un punteggio di 2,415 (0,897 * 2,692)


sabato 27 giugno 2015

Goal timing in 6 European Leagues (2014/2015 season)


This table shows the distribution of the goals scored in this season (2014/2015) in the 6 main European leagues. I have divided the matches in 15 minutes segments, but I decided to separate the goals scored in the injury time after the 90th minute, to get a more balanced result (otherwise too many goals seemed to be scored between the 75th and the 90th). The goals scored in the first half injury time are counted inside the "31-45" segment, but they shouldn't be too many and don't shift the distribution. 
           1-15    16-30    31-45    46-60    61-75    76-90     >90   goals
                                                                       
England   13,23%   15,59%   18,36%   14,97%   16,72%   16,92%   4,21%    975
France    12,46%   14,15%   17,53%   15,10%   17,32%   19,01%   4,44%    947
Germany   12,57%   14,47%   16,96%   16,25%   16,01%   20,05%   3,68%    843
Italy     12,21%   16,89%   17,09%   16,31%   17,58%   15,14%   4,79%   1024
Portugal  11,40%   12,71%   16,78%   19,27%   14,94%   19,40%   5,50%    763
Spain     11,10%   14,27%   19,82%   15,06%   16,45%   18,63%   4,66%   1009

Global    12,17%   14,78%   17,82%   16,04%   16,58%   18,07%   4,53%   5561
The top segments were the last of the two halves.
In Portugal many goals were also scored at the beginning of the second half, and in Italy in the middle of the second half.
The highest percentage was in Germany during the last 15 minutes (169 out of 843, meaning 20,05% of the total goals).
In all the countries, the least prolific segment was the first (1-15).


La tabella qui sopra mostra la distribuzione temporale delle reti segnate nei 6 principali campionati europei finora in questa stagione.
Ho diviso le partite in segmenti di 15 minuti, ma separando i gol segnati nel tempo di recupero per avere un risultato più bilanciato (altrimenti sembrerebbero essere stati segnati troppi gol tra il 75° e il 90°).
Le reti segnate nel recupero del primo tempo sono contate nel segmento "31-45", ma non dovrebbero essere molte e quindi non spostano di molto la distribuzione.

I segmenti più prolifici sono stati gli ultimi di entrambi i tempi.
In Portogallo sono state segnate molte reti anche all'inizio del secondo tempo, e in Italia nel segmento centrale del secondo tempo.
Il segmento con la più alta percentuale è stato quello finale della Germania (169 gol su 843, cioè il 20,05% del totale).
In tutte le nazioni, il segmento più avaro di gol è stato il primo (minuti 1-15).


giovedì 25 giugno 2015

Half Time / Full Time statistics at the end of the season 2014/2015


These are the statistics regarding the best and the worst teams in the first and the second half in the last season (2014/2015).

When I write two capital letters, the first is the result at half-time, and the second is the result at the end of the match; for example, LD means that the team was losing at half-time, but eventually managed to equalize the match.
When I write a letter and a number, the letter is the result, and the number is the half; for example, D2 means a draw in the second half.
Of course, W=win, D=draw, L=loss.

I consider only the club teams of England, France, Germany, Italy, Portugal and Spain.

Juventus (Italy) was the only team who never trailed at the end of the first half, with 23 W1 and 15 D1 out of 38 matches.

All the teams led at least once at half-time.

Juventus was also the best team as for the average points made at the end of the first half: 2,21.
The worst team after the first half was Paderborn (Germany), with 2 W1, 18 D1 and 14 L1 (0,71 average points).

The best team in the second half was Barcelona (Spain) with 27 W2, 7 D2 and 4 L2 (2,32 average points).
The worst teams were Cordoba (Spain) and Aston Villa (England) with 2 W2, 17 D2 and 19 L2 (0,61 average points).

The team who did best at the end of the match comparing to the first half was Sporting CP (Portugal), who passed from 10/19/5 in the first half (1,44 points) to 22/10/2 (2,24 points), with a positive difference of 0,800 average points per match.
The worst team was Penafiel (Portugal), who passed from 8/15/11 in the first half (1,15 points) to 5/7/22 (0,65 points), with a negative difference of 0,500 average points per match.

-----------------------------------------------------------------------------------------------------------------

These are the best and worst teams in keeping the lead or coming back in the second half. 
Among the clubs of England, France, Germany, Italy, Portugal and Spain, I consider only the teams who had W1 (winning at half-time) or L1 (trailing at half-time) at least in one third of the matches played.

The best team in keeping the lead was AS Roma (Italy), with 15 WW out of 15 W1 matches. There are other 5 teams with full marks, but they didn't reach the threshold of one third of W1 matches out of the totality of the matches played.
The worst team in keeping the lead was Moreirense (Portugal), with 4 WL and 2 WD out of 12 W1; in the second halves of these matches, they lost 1,33 points per game.
The best teams in coming back were FC Augsburg (Germany) and Caen (France), respectively with 3LW/1LD and 2LW/4LD out of 13 L1 each; in the second halves of these games, they both gained 0,77 points per game.
The worst team in coming back was Aston Villa (England), with 15 LL out of 15 L1. Also Metz (France) had the same result (never got back from an L1) and also met the threshold, but they had "only" 14 L1 (with 14 LL, of course).


Queste sono le statistiche riguardanti le migliori e peggiori squadre nel primo e nel secondo tempo durante la scorsa stagione (2014/2015).

Quando scrivo due lettere maiuscole, la prima indica il risultato del primo tempo, e la seconda è il risultato al termine della partita; per esempio, LD significa che la squadra stava perdendo alla fine del primo tempo, ma poi è riuscita a pareggiare.
Quando scrivo una lettera maiuscola e un numero, la lettera è il risultato, mentre il numero è il tempo; quindi ad esempio D2 indica un pareggio nel secondo tempo.
Significato: W=vittoria, D=pareggio, L=sconfitta.

Ho preso in considerazione le squadre di Francia, Germania, Inghilterra, Italia e Spagna.

La Juventus (Italia) è stata l'unica squadra a non essere mai stata in svantaggio alla fine del primo tempo (23 W1 e 15 D1 in 38 partite).

Tutte le squadre sono andate al riposo in vantaggio almeno una volta.

La Juventus è stata anche la migliore squadra per la media punti ottenuta al termine del primo tempo: 2,21.
La squadra peggiore è stata il Paderborn (Germania), con 2 W1, 18 D1 e 14 L1 (0,71 punti di media).

La squadra migliore nel secondo tempo è stata il Barcelona (Spagna) con 27 W2, 7 D2 e 4 L2 (2,32 punti di media).
Le squadre peggiori sono state il Cordoba (Spagna) e l'Aston Villa (Inghilterra) con 2 W2, 17 D2 e 19 L2 (0,61 punti di media).

La squadra che ha fatto meglio al termine della partita in confronto al primo tempo è stato lo Sporting CP (Portogallo), che è passato da un 10/19/5 nel primo tempo (1,44 punti) a un 22/10/2 (2,24 punti), con una differenza positiva di 0,800 punti per partita.
La squadra peggiore è stata il Penafiel (Portogallo), che è passato da 8/15/11 nel primo tempo (1,15 punti) a 5/7/22 (0,65 punti), con una differenza negativa di 0,500 punti per partita.

-----------------------------------------------------------------------------------------------------------------

Queste sono le squadre migliori e peggiori nel mantenere un vantaggio o recuperare uno svantaggio durante il secondo tempo delle partite.
Tra le squadre di Francia, Germania, Inghilterra, Italia e Spagna, ho preso in considerazione solo quelle che hanno un numero di W1 (vittorie alla fine del primo tempo) o L1 (sconfitte alla fine del primo tempo) uguale ad almeno un terzo delle partite giocate. 

La squadra migliore nel mantenere il vantaggio è stata la Roma (Italia), con 15 WW su 15 W1. Altre 5 squadre hanno fatto punteggio pieno, ma non hanno raggiunto la soglia di un terzo di partite con W1 sul totale delle partite giocate.
La squadra peggiore nel mantenere il vantaggio è stata la Moreirense (Portogallo), con 4 WL e 2 WD su 12 W1; nei secondi tempi di queste partite, la squadra ha perso 1,33 punti per gara.
Le squadre migliori nel recuperare lo svantaggio sono state l'Augsburg (Germania) e il Caen (Francia), rispettivamente con 3LW/1LD e 2LW/4LD su 13 L1 ciascunonei secondi tempi di queste partite, entrambe queste squadre hanno guadagnato 0,77 punti per gara.
La squadra peggiore nel recuperare lo svantaggio è stata l'Aston Villa (Inghilterra), con 15 LL su 15 L1. Anche il Metz (Francia) non ha mai recuperato da un L1 e inoltre supera anche la soglia minima di un terzo, ma ha avuto "solo" 14 L1 (con 14 LL, ovviamente).


sabato 13 giugno 2015

European Cups Ranking System: 2014-2015 final rank


According to the ECRS, the final ranking for this season is:
Barcelona (ESP) 714,13 points
Juventus (ITA) 499,87
Porto (POR) 499,14

The complete ranking is here.


Secondo l'ECRS, la classifica finale di questa stagione è la seguente:
Barcellona (ESP) 714,13 points
Juventus (ITA) 499,87
Porto (POR) 499,14

La classifica completa si trova qui.


giovedì 11 giugno 2015

Frequent scores in European leagues 2014/2015


These are the most frequent scores in the 10 main European leagues in this season (2014/2015).

Belgium: 1-0 and 1-1 (10,83% each)
England: 0-1 (10,53%)
France: 1-0 (13,16%)
Germany: 1-0 (10,46%)
Italy: 1-1 (15,00%)
Netherlands: 1-1 (11,11%)
Portugal: 1-1 (15,03%)
Russia: 1-0 and 1-1 (13,33% each)
Spain: 1-1 (11,32%)
Ukraine: 0-0 (13,81%)

The result of England is quite strange: the most frequent score is an away win by 1-0 (40 matches out of 380).


Questi sono i risultati più frequenti delle partite giocate nei 10 principali campionati europei questa stagione (2014/2015).

Belgio: 1-0 e 1-1 (10,83% ciascuno)
Francia: 1-0 (13,16%)
Germania: 1-0 (10,46%)
Inghilterra: 0-1 (10,53%)
Italia: 1-1 (15,00%)
Olanda: 1-1 (11,11%)
Portogallo: 1-1 (15,03%)
Russia: 1-0 e 1-1 (13,33% ciascuno)
Spagna: 1-1 (11,32%)
Ucraina: 0-0 (13,81%)

Il risultato dell'Inghilterra è abbastanza strano: il punteggio più frequente è stata la vittoria fuori casa per 1-0 (40 partite su 380).

lunedì 8 giugno 2015

The numbers of the Champions League (semi-finals and final)


Barcelona won the European Cup/Champions League for the 5th time (out of 8 finals).
Juventus set the new negative record of lost finals: 6 out of 8.

The top scorers of this season have been Neymar (Barcelona), Messi (Barcelona) and Cristiano Ronaldo(Real Madrid), with 10 goals each. The all-time top scorers are Messi and Cristiano Ronaldo, with 77 goals each (Ronaldo scored another goal in the qualification stage playing with Manchester United).

For the 7th time, the final has been played between an Italian and a Spanish team. Italy won twice and Spain five times. This is the list:
1956-1957: Real Madrid-Fiorentina 2-0
1957-1958: Real Madrid-Milan 3-2
1963-1964: Internazionale-Real Madrid 3-1
1991-1992: Barcelona-Sampdoria 1-0
1993-1994: Milan-Barcelona 4-0
1997-1998: Real Madrid-Juventus 1-0
2014-2015: Barcelona-Juventus 3-1

For the 11th time (5th in a row), 2 Spanish teams reached the semi-finals.
In the last 5 years, Barcelona and Real Madrid always reached the semi-finals, excluding last season when Barcelona was "replaced" by Atletico Madrid.
Since 2000-2001, only in the semi-finals of 2003-2004 and 2009-2010 there weren't 2 teams from the same football association.
The record (3 teams) belongs to Spain (1999-2000), Italy (2002-2003) and England (2006-2007, 2007-2008, 2008-2009).
Only in 2012-2013 there were 2 pairs of teams from 2 different football associations (Germany and Spain).
This is the complete list:
1958-1959: Atletico Madrid and Real Madrid
1959-1960: Barcelona and Real Madrid
1999-2000: Barcelona, Real Madrid and Valencia
2000-2001: Real Madrid and Valencia
2001-2002: Barcelona and Real Madrid
2002-2003: Internazionale, Juventus and Milan
2004-2005: Chelsea and Liverpool
2005-2006: Barcelona and Villareal
2006-2007: Chelsea, Liverpool and Manchester United
2007-2008: Chelsea, Liverpool and Manchester United
2008-2009: Arsenal, Chelsea and Manchester United
2010-2011: Barcelona and Real Madrid
2011-2012: Barcelona and Real Madrid
2012-2013: Bayern Munich and Borussia Dortmund, Barcelona and Real Madrid
2013-2014: Atletico Madrid and Real Madrid
2014-2015: Barcelona and Real Madrid


Il Barcellona ha vinto la sua quinta Coppa dei Campioni/Champions League (su 8 finali disputate).
La Juventus ha stabilito il nuovo record negativo di finali perse (6 su 8).
I migliori marcatori di questa edizione sono stati Neymar (Barcellona), Messi (Barcellona) e Cristiano Ronaldo (Real Madrid), con 10 reti ciascuno. I migliori marcatori di tutti i tempi sono Messi e Cristiano Ronaldo, con 77 reti ciascuno (Ronaldo ha segnato un ulteriore gol nei turni di qualificazione quando giocava nel Manchester United).

Per la settima volta, la finale è stata giocata tra una squadra italiana e una spagnola. L'Italia ha vinto due volte e la Spagna cinque. La prima delle due liste sopra contiene l'elenco di queste finali.

Per l'11a volta (5a di fila), 2 squadre spagnole sono arrivate alle semifinali.
Negli ultimi 5 anni, Barcellona e Real Madrid hanno sempre raggiunto le semifinali, con l'eccezione dell'anno scorso quando il Barcellona fu "sostituito" dall'Atletico Madrid.
Dal 2000-2001, solo nelle semifinali del 2003-2004 e del 2009-2010 non ci sono state due squadre facenti parte della stessa associazione calcistica.
Il record (3 squadre) appartiene a Spagna (1999-2000), Italia (2002-2003) e Inghilterra (2006-2007, 2007-2008, 2008-2009).
Solo nel 2012-2013 ci furono 2 coppie di squadre di 2 diverse associazioni calcistiche (Germania e Spagna).
La seconda lista sopra contiene l'elenco completo.


giovedì 4 giugno 2015

Over/Under at the end of the season


At this link you can see a table with the comparison among the top 10 European leagues in the last 6 seasons, regarding the percentages of matches with a number of goals over 1,5, 2,5 or 3,5.
I also wrote the average percentages for the period 2009-2014, comparing it with the last season (2014-2015): if this is written in green it is over the average, otherwise it is written in red.

You can see that this year's percentages fell almost everywhere (compared to the average) except in Italy, where they raised by 2,5% or 3,5%.
Belgium and Ukraine had an increment in matches ended over 2,5 or 3,5.
The other countries are almost always under the average.
Netherlands still have the highest percentages in each of the three categories, Russia the worst.


questo link potete vedere una tabella con il confronto tra i 10 principali campionati europei, riguardo alle percentuali di partite terminate con un risultato "over" 1,5, 2,5 o 3,5 nelle ultime 6 stagioni.
Ho anche inserito la media (colonna H) per il periodo 2009-2014, confrontandola con il dato dell'ultima stagione (2014-2015): se questo è scritto in verde, significa che è stato superiore alla media, altrimenti è scritto in rosso.

Si può vedere che le percentuali di quest'anno sono scese quasi ovunque (rispetto alla media) eccetto che in Italia, dove sono salite di un punteggio tra il 2,5% e il 3,5%.
Belgio e Ucraina hanno avuto un incremento delle partite finito con un "over" 2,5 o 3,5.
Le altre nazioni sono quasi sempre rimaste sotto la media.
L'Olanda ha ancora le percentuali più alte in tutte le tre categorie, mentre la Russia ha le peggiori.


martedì 2 giugno 2015

Scoring trend at the end of the season


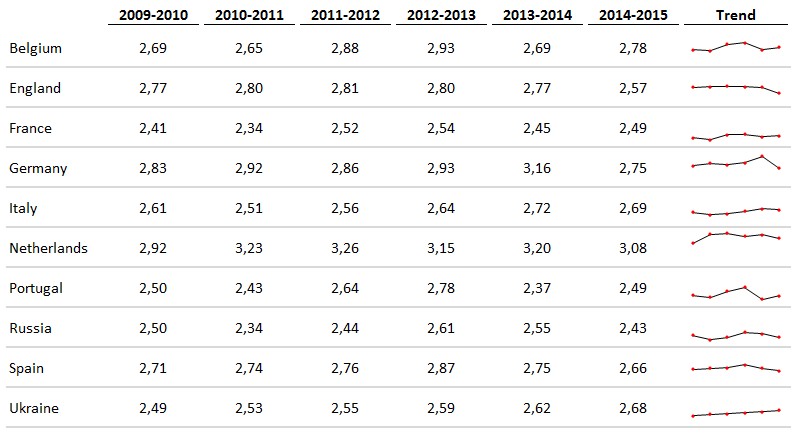
In the following table there is the average number of goals scored per game in the 10 main European leagues, considering the last 6 seasons, including the current one (just ended).
You can also see the trend for each league.

Dutch Eredivisie had the best result also this year, as usual, though its average decreased from 3,20 to 3,08.
German Bundesliga fell from 3,16 to 2,75, and now it is third, having been surpassed by Belgian Pro League (2,78).
English Premier League is now at 2,57 after having been stable for the past five seasons (always between 2,77 and 2,81).
Ukrainian Prem'er Liha had the sixth consecutive season with an increment.
Portuguese Primeira Liga had the best increment (from 2,37 to 2,49), but they are still low compared to the other countries.


Nella tabella soprastante potete vedere il numero medio di reti per partita segnate nei 10 principali campionati europei, considerando le ultime 6 stagioni inclusa quella attuale (appena terminata).
All'estrema destra di ciascuna riga si può vedere il trend del rispettivo campionato.

La Eredivisie olandese ha avuto ancora una volta il miglior risultato, come sempre, anche se la sua media è scesa da 3,20 a 3,08.
La Bundesliga tedesca è crollata da 3,16 a 2,75 e ora è terza, essendo stata superata dalla Pro League belga (2,78).
La Premier League inglese è ora a 2,57 dopo essere rimasta stabile nelle cinque stagioni precedenti (sempre tra 2,77 e 2,81).
La Prem'er Liha ucraina ha vissuto la sua sesta stagione consecutiva con un aumento delle reti segnate.
La Primeira Liga portoghese ha avuto il maggior incremento (da 2,37 a 2,49), ma il valore è ancora basso rispetto alle altre nazioni.


domenica 17 maggio 2015

European Leagues winners 2014/2015


At this link you find the list of the European football leagues, with the clubs who already won or the current leaders.


A questo link trovate la lista dei campionati nazionali europei di calcio, con le squadre che hanno già vinto il torneo o la squadra attualmente prima in classifica.


giovedì 9 aprile 2015

Goal timing in 6 European leagues - updated as of 31 March


This is the goal distribution, updated as of the end of March, in the top six European football leagues.
The distribution is per segments of 15 minutes, plus the injury time after the 90th minute.
You can find the previous table here (mid of January).
All the countries keep having the fewest goals in the first segment of the matches.


La tabella sopra mostra la distribuzione percentuale delle reti segnati nei 6 principali campionati europei, per ogni segmento di 15 minuti e il recupero dopo il 90° minuto.
I dati sono aggiornati alla fine di marzo. La tabella precedente è qui (metà gennaio).
Tutte le nazioni continuano ad avere il minor numero di goal segnati nel primo quarto d'ora di gara.

martedì 24 marzo 2015

Some other statistics about the Champions League's Round of 16


Chelsea is out of the Champions League without losing a single match:
4 wins and 4 draws.

For the third time, a Madrid derby will be played in the Champions League/European Cup: the first time was a semifinal in 1958-1959, when Real Madrid won the playoff 2-1 (the two legs ended 2-1 and 0-1, and there was no extra-time), and the second was last year's final, when Real Madrid won 4-1 after extra-time.


This is the list of the teams who reached the quarter-finals, with the number of times that they already played this round in the Champions League/European Cup, and the year when they played the last time this round.

Atletico Madrid: 6 times (last in 2014)
Barcelona: 16 (2014)
Bayern Munich: 25 (2014)
Juventus: 15 (2013)
Monaco: 3 (2004)
Paris Saint-Germain: 3 (2014)
Porto: 6 (2009)
Real Madrid: 31 (2014)


Il Chelsea è fuori dalla Champions League senza aver perso alcuna partita:
4 vittorie e 4 pareggi.


Per la terza volta, un derby di Madrid sarà giocato in Champions League/Coppa dei Campioni: la prima volta fu una semifinale nel 1958-1959, quando il Real Madrid vinse lo spareggio 2-1 (andata e ritorno finirono 2-1 e 0-1, e non c'erano tempi supplementari), e la seconda fu la finale dell'anno scorso, quando il Real Madrid vinse 4-1 dopo i tempi supplementari.


Questa è la lista delle squadre che hanno raggiunto i quarti di finale, con il numero di volte che ciascuna ha già giocato questo turno in Champions League/Coppa dei Campioni, e l'anno in cui ha giocato l'ultima volta questo turno.

Atletico Madrid: 6 volte (l'ultima nel 2014)
Barcellona: 16 (2014)
Bayern Monaco: 25 (2014)
Juventus: 15 (2013)
Monaco: 3 (2004)
Paris Saint-Germain: 3 (2014)
Porto: 6 (2009)
Real Madrid: 31 (2014)


sabato 21 marzo 2015

European Cups: Villareal are out of the Cups, but they are at the top of the ranking


According to the ECRS, after the Round of 16 Villareal (Spain) is the best team in the European Cups, with 414,77 points, though they were eliminated in the last round by Sevilla.
At the second place there is the first team still in the competition, Club Brugge (Belgium), with 394,84.
At the third place we find the former second-place team, Dynamo Moscow (Russia), with 380,85 points.

All these three teams played or are playing in Europa League; the best team in Champions League is Porto (Portugal), at 4th overall place with 358,46 points.

The worst team still in the competition is Paris Saint-Germain (France), who passed the last round drawing twice against Chelsea; they are in the 54th position with 158,71 points.

The complete ranking is here.


Secondo l'ECRS, dopo gli ottavi di finale il Villareal (Spagna) è la migliore squadra attualmente nelle coppe europee, con 414,77 punti, pur essendo stato eliminato dal Siviglia.
Al secondo posto c'è la prima squadra ancora in gara, il Club Brugge (Belgio), con un punteggio di 394,84.
Perde una posizione in classifica la Dinamo Mosca (Russia), che ora si trova al terzo posto con 380,85 punti.

Tutte queste tre squadre hanno giocato o stanno giocando in Europa League; la squadra migliore in Champions League è il Porto (Portogallo), al quarto posto generale con 358,46 punti.

La squadra peggiore ancora in gara è il Paris Saint-Germain (Francia), che si è qualificata per i quarti di finale pareggiando due volte contro il Chelsea; i francesi occupano la 54esima posizione con 158,71 punti.

La classifica completa si trova qui.


giovedì 12 marzo 2015

Bayern Munich scored 7 goals in Champions League (again)


Yesterday, Bayern Munich won 7-0 at home against Shakhtar Donetsk, after having tied 0-0 the first leg in Ukraine.
It's the third time that Bayern Munich score 7 goals in the 2nd leg of the Champions League's Round of 16: it happened twice in recent years, the first time in 2008-2009 against Sporting Lisbon (1st leg 5-0 and 2nd leg 7-1), and the second time in 2011-2012 against FC Basel (they lost the first leg 0-1, and then won 7-0 in Munich).
This was also the last time that a team scored at least 7 goals in a Champions League match, considering only the rounds from the Round of 16 onwards. Barcelona also won 7-1 against Bayer Leverkusen in the same round of 2011-2012 season, but this happened the week before Bayern Munich's match against FC Basel.


Ieri il Bayern Monaco ha vinto 7-0 in casa contro lo Shakhtar Donetsk, dopo aver pareggiato all'andata 0-0 in Ucraina.
È la terza volta che il Bayern Monaco segna 7 reti nel ritorno di un ottavo di finale di Champions League: è successo entrambe le volte in tempi recenti, la prima nel 2008-2009 contro lo Sporting Lisbona (andata 5-0 e ritorno 7-1), e la seconda nel 2011-2012 contro il Basilea (i tedeschi avevano perso all'andata 0-1 per poi vincere 7-0 a Monaco).
Questa era anche l'ultima volta in cui una squadra aveva segnato almeno 7 reti in una partita di Champions League, considerando i turni dagli ottavi di finale in poi. Anche il Barcellona aveva battuto 7-1 il Bayer Leverkusen nello stesso turno della stagione 2011-2012, ma la partita era stata giocata la settimana prima di Bayern Monaco - Basilea.


mercoledì 11 marzo 2015

Real Madrid conceded 4 goals at home after 15 years


Yesterday, Real Madrid suffered a 3-4 loss at home against Schalke 04, but they managed to go through the round of Champions League.
The last (and only) time that Real Madrid conceded 4 goals at home in a European Cup was on 29th February 2000, against another German team, Bayern Munich; the match ended 2-4. It was the third matchday of the second group stage, and both the teams finally went through the stage.


Ieri il Real Madrid ha subìto una sconfitta per 3-4 in casa contro lo Schalke 04, ma è riuscito comunque a superare il turno di Champions League.
L'ultima (e unica) volta che il Real Madrid concesse 4 reti in casa in una coppa europea fu il 29 febbraio 2000, contro un'altra squadra tedesca, il Bayern Monaco; la partita terminò 2-4. Si trattava della terza giornata della seconda fase a gironi, ed entrambe le squadre riuscirono a superare il turno.


martedì 10 marzo 2015

Stats about goals scored in the top European leagues


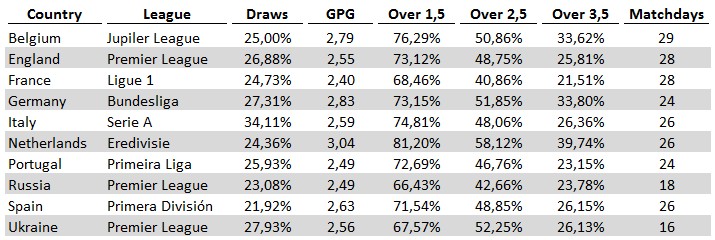
In the table below you can see some stats about the top 10 European leagues, regarding the matches played until now in this season.

This is the legend:
Draws = percentage of matches ended with a draw;
GPG = average goals scored per game;
Over 1,5 / Over 2,5 Over 3,5 = percentage of matches where the total number of goals was over the set threshold;
Matchdays = number of matchdays played until now.

The league with the highest number of goals scored per game is the Eredivisie (Netherlands), while the French Ligue 1 has the lowest.
Italy's Serie A is the league with the highest number of draws.


Nella tabella qui sopra potete vedere alcune statistiche dei 10 principali campionati europei, riguardo alle partite giocate finora in questo inizio di stagione.

Questa è la legenda:
Draws = percentuale di partite terminate con un pareggio;
GPG = media delle reti segnate per partita;
Over 1,5 / Over 2,5 Over 3,5 = percentuale di partite in cui sono state segnate più reti del limite indicato;
Matchdays = numero di giornate giocate finora.

Nella tabella si nota che il campionato dove si segnano più gol per partita è la Eredivisie olandese, mentre quello in cui si segna di meno è la Ligue 1 francese.
La Serie A italiana è il campionato con il maggior numero di pareggi.